Churn Prediction Project
Project Description
I lead a cross-functional project with Sales, Customer Success, and Support teams within an Organization to develop a predictive tool for customer churn powered by machine learning. Wanting to use the skills that I created in my Master's program, I reached out to leadership and stakeholders for any potential data science project. Using my discussions with the stakeholders and my understanding of business needs and goals, I devised a project where I would act as an internal consultant on using machine learning to predict customer churn. I obtained datasets that were relevant to Customer Support, Development, and Services touchpoints with customers.
To understand the organization's needs, I led Customer Success Management (CSM) interviews to fully comprehend the datasets I obtained and contextualize my data management and reporting. These interviews led to the need for a tool for planning and reporting that could be visualized across the organization to touch on Support, CSM, Sales, and Development initiatives. Using PowerBI, I created a dashboard to aid in the planning process for CSM to proactively reach out to clients and ensure a proactive approach to the day-to-day CSM. The dashboard was then presented to director-level leadership, which is now used in the day-to-day process of all these cross-functional teams.
Initial Findings
To understand the full scope of this project and the business need for predicting churn, I contacted various individuals from CSM, Sales, and Support to help understand the data I obtained. Contextualizing this data was important because it helped determine lagging and leading variables that could be used in the predictive model. Lagging variables included data points that aren’t being updated regularly or only when a customer has already requested information to leave the organization. These insights aided in the feature selection process of this project, allowing for better predictions.
Also, in my initial CSM interviews, it became clear that the working procedure for predicting customer churn was based solely on impressions and subjective reporting. CSMs wanted a solution to streamline planning and determine which customers were the most at risk. This is where a dashboard would come into play to aid in planning and understanding how customers interact with the business.
I did some exploratory data analysis, descriptive statistical analysis, and missing value imputation to understand the dataset and potential factors. The findings from the EDA process led to further SME interviews to understand missing values, outliers, and anything else that came up in this process.
My initial machine-learning solution used a Logistic Regression model to depict trends. I decided to use a Logistic Regression model to show a quick turnaround and visualize the factors that led to the model making certain decisions. Logistic Regression is the best option for this use case because it is easy to understand, and most leaders could quickly understand the concepts of the model without advanced knowledge. The initial model was able to have an 88% accuracy score, but there was room for improvement.
After developing this first iteration, I brought my findings to key organizational stakeholders, including the Director of Customer Success and Product Support. In this presentation, I conveyed my results at a high level, helping stakeholders understand how the tool could be used and the benefits of using this methodology for sales, CSMs, and support teams. The following presentation is the same, with all pertinent information taken out.
Machine Learning Development
The initial model showed an 88% accuracy rate with simple feature selection and data cleaning outlined above. However, the model could have been better at distinguishing when a customer would churn. The ratio of churns to active customers was 1:10, which doesn’t allow for good recall and, in conjunction, very good precision of those determinations. This is where I decided to use upsampling techniques to artificially create more customers that churned to aid in the model's training. This aided in an increase in recall and precision of the churned customer.
After this, I introduced a new training model and decided to use Support Vector Machines (SVM) because they are robust to overfitting, effectively train smaller datasets, and work well with sparse data. The sparsity of the dataset showed up the most when trying to determine when clients had development or support cases; not all customers have development cases.
Using SVMs also allowed for a greater level of hyperparameter tuning, where I tested multiple C-parameters and gamma values to aid in the decision-making process. The c-parameter is a penalty on each misclassified data point and gamma is the closeness of the points to one another. Testing multiple values of these hyperparameters led to increased accuracy, recall, and precision of the churned customers.
Lastly, I changed the training sets to be on a year-by-year basis. I trained 2021 to test 2022 data to mimic more of a business decision-making process. The model I created in this methodology predicted 2022 data with a 96% accuracy rate. While there is still a battle with the precision and recall of the model, further development is needed to increase the accuracy of this model.
PowerBI Dashboard
Now that we have a working model with a 96% accuracy rate, I created a PowerBI Dashboard to show leadership how this tool could be used in a day-by-day process. Creating this dashboard, I was filling the wishes from SME interviews to create a tool that CSMs could use to aid in decision-making for client churn potential and if they need to reach out proactively to ensure there isn’t anything wrong with our relationship with our clients. The graphic below shows the PowerBI dashboard that I created with anonymized data.
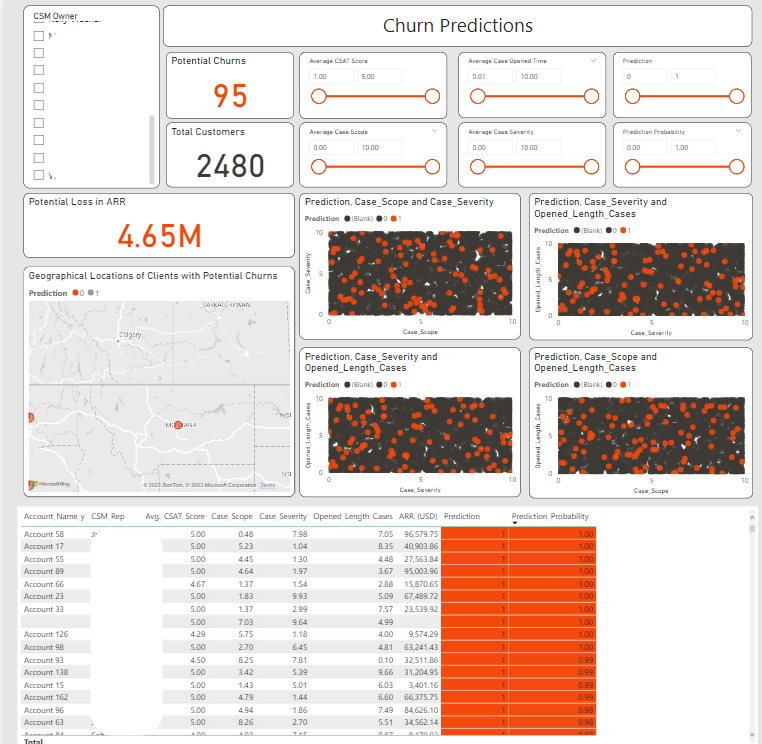
This dashboard will be used to plan CSMs day to day, month to month, in determining clients that were at the most amount risk of to churning out of the company. Using color encoding, graphs, charts, sliders, and tables enables the dashboard user to disclose trends within the customers and indicators to churn thoroughly. This gives context for users to interact with the customer and start a proactive customer relationship rather than a reactionary one.
Next Steps
By holding a range of presentations to show leadership the dashboard's capabilities and the models' accuracy, I learned about the next steps within the project space. These included different datasets that have become available to me and different feature selection and manipulation ideas that would improve the model significantly.
The following steps of this process would need more resources from the organization to employ a more pointed role in diving into the datasets and planning data management against data sources across the organization. More data and an understanding of the current limitations in the dataset would need to be employed to make the management of this data needed to improve the model even more.